5 metrics you need to know as a Steady creator
We've redesigned your publisher dashboard and added important data. Here are the numbers you should keep an eye on to keep your project moving forward.

Your new publisher dashboard (S'ouvre dans une nouvelle fenêtre) is here! With it we want to give you a better overview of the metrics that are important for your project without you having to take a course on data science. The dashboard is divided into different elements that provide you with information about sales, subscriber and member numbers, as well as long-term metrics:
Here are five numbers you should definitely keep an eye on – and what they mean for your Steady project:
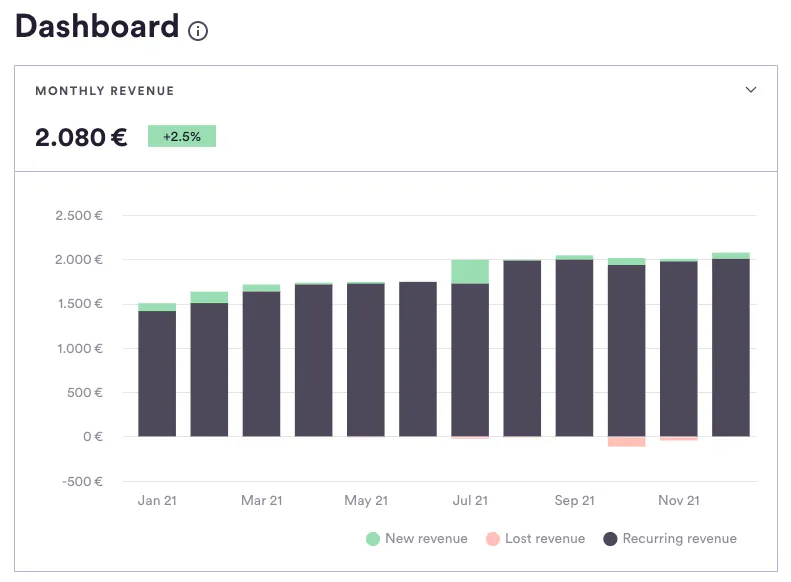
1. Monthly revenue
At the top is the most important number: your monthly revenue. Next to it you will see a slightly smaller number that shows how your turnover has changed proportionally compared to the previous 30 days.
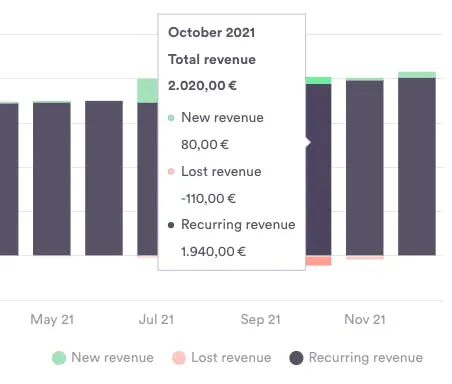
Below that, a new graph appears that shows your revenue development over the past 12 months. The stacked bars show recurring revenue from existing members (grey), lost revenue from cancellations (red) and revenue from new memberships (green). If you move your mouse over a bar, more detailed information about the respective month will be displayed.
2. Conversion
Conversion is when you gain a new member, i.e. when this person "converts" from non-member to member.
What is interesting for you is how high your conversion rate is in two different groups: among your newsletter subscribers (S'ouvre dans une nouvelle fenêtre) and among trial members (S'ouvre dans une nouvelle fenêtre) (of course, only if you also collect subscribers or offer trial memberships).
You can now see both in the new dashboard (S'ouvre dans une nouvelle fenêtre):
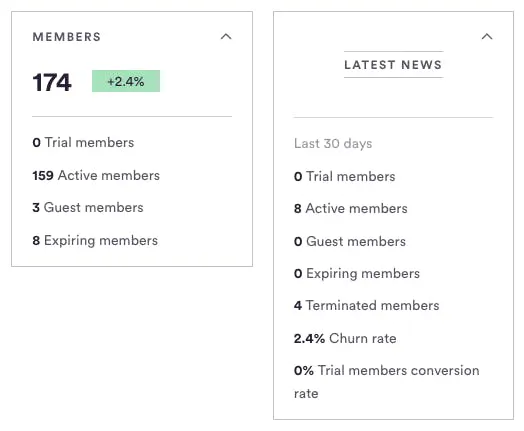
If you open Newsletter Subscribers, you will see how many newsletter subscribers have become paying members in the previous 30 days.
In the Latest News section, some metrics appear, including how many trial members have decided to support you during or after the trial period.
Pay close attention to this conversion and work to keep it up, or better yet, increase it. This is how you gain new revenue.
There are several ways to convert subscribers into members. The simplest, most efficient method is to always mention your membership programme – at least at the beginning and the end of every newsletter you send out, but every now and then also in an extra newsletter and some social media posts.
Shortly before the end of the trial month, you could send a personal email to guest members inviting them to support your project.
3. Churn
Just as important as conversion is churn, i.e. how many members you lose each month. You can find this information in the Latest News section (see above). It refers to the previous 30 days and is given as a percentage in relation to your total revenue.
It is quite normal to lose members from time to time. An average Steady project has 2-3% churn per month. At the same time, you will gain new members and may even be able to win back churned members at some point.
Keep a close eye on this rate and monitor changes: If you experience unusually high churn, you can think about what caused it. Often this happens about a year after the start of your membership programme, because that's when many annual memberships will expire. What's equally important is working on strengthening your community to reduce churn. At Steady, we're putting together a guide to help you do exactly that – stay tuned!
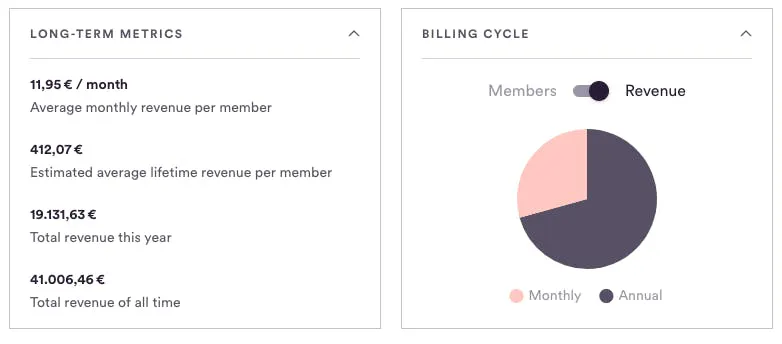
4. Average monthly revenue per member
In the long-term metrics section, you will find important figures for planning your membership programme long-term. Included there is how much a member pays you on average per month. The average value for Steady is around 5.50 euros per member per month.
Have you noticed that most of your members buy the most expensive plan? Then many of them would probably be willing to pay more, which means that your prices are too low.
Or are most of your members on the lowest plan? Then you might be able to convince them to choose a more expensive plan by offering more attractive benefits (S'ouvre dans une nouvelle fenêtre) in return.
5. Average lifetime revenue of a member
You can also find this formation under Long-Term Metrics. It shows how much revenue a member brings you in total, i.e. how much a member pays on average from the beginning to the end of a membership.
We calculate this number by multiplying the average duration of a membership by average monthly revenue per member.
We use Steady-wide data for this calculation in case there is not enough project-specific data yet. After all, Steady members are very loyal: the average duration of a membership on Steady is three years.
This metric is not only interesting and shows how much more sustainable memberships are compared to individual donations. It can also help you when spending money to attract members (for example, for advertisements or thank-you bonuses). As a rough guide, we recommend the formula 1:4, so if you spend about a quarter of one member's lifetime revenue to attract one new member, you're in the black.
What do you think of the new dashboard?
We've put a lot of thought into how we should redesign the dashboard and what numbers are important to Steady publishers like you. Do you find the new dashboard helpful? And does it have everything you need? Feel free to tell us what you think, simply by replying to this email. Thanks! 🤝
PS: If you find yourself missing the old dashboard, you can switch back to the old view.
More in the media

Steady Grants (S'ouvre dans une nouvelle fenêtre) for media makers: We're paying a total of 55,000 euros to projects that want to take the next step towards community funding. Apply now (S'ouvre dans une nouvelle fenêtre)!
And a throwback: How this newsletter writer got her readers to pitch in with story ideas and proofreading support (S'ouvre dans une nouvelle fenêtre)
Steady Magazine (S'ouvre dans une nouvelle fenêtre) | Instagram (S'ouvre dans une nouvelle fenêtre) | Twitter (S'ouvre dans une nouvelle fenêtre) | Facebook (S'ouvre dans une nouvelle fenêtre) | LinkedIn (S'ouvre dans une nouvelle fenêtre)
You received this email because you're a Steady creator or just interested in Steady. If you no longer wish to receive this newsletter, you can unsubscribe below – or (if you have a Steady account) adjust your notifications (S'ouvre dans une nouvelle fenêtre) in your settings.