Struggling with Linear Regression? - Theory and Practice Clearly explained
Last updated: September 23, 2024
Linear Regression is a simple statistical regression method, making it perfect for beginners in predictive analysis. It is a straightforward method, but some aspiring data scientists struggle to understand the mathematical aspects.
Terms like intercept or residuals occur? We want to bring light into the darkness!
There are many resources on the internet that try to explain this method. However, these explanations often use incorrect variable names or forget some indices on the variables.
Our goal is that you understand linear regression visually, mathematically, and practically. First, we explain the intuition of the linear regression visually. Then, we go deeper into the mathematical explanation. Finally, we look at a practical example from the economy. To get our data, we use the Python package OpenBB.
As a Data Scientist, it is essential to understand how this basic statistical method works. Always keep in mind, that you can often solve tasks with simple statistical methods before you need to use advanced ML models. For this reason, you should always try to solve problems with simple methods like linear regression before you use advanced ML methods.
We’ll discuss the following points:
Visual Explanation
Mathematical Explanation
How can we calculate the Residuals?
How can we calculate the Intercept and the Slope?
Assumptions of a Linear Regression
Common Evaluation Metrics
Real-world example with economic data
Set up the environment
Data Understanding and Preparation
Modeling
Evaluation
Conclusion
+ Bonus: At the end of the article, you‘ll get a high-resolution cheat sheet with all the important aspects of linear regression.
So we’ve no time to waste. Let’s dive in!
Visual Explanation
You can perform linear regression with multiple variables or just one. For the explanation, we’ll focus on using a single variable, so it’s easier to grasp. 😊
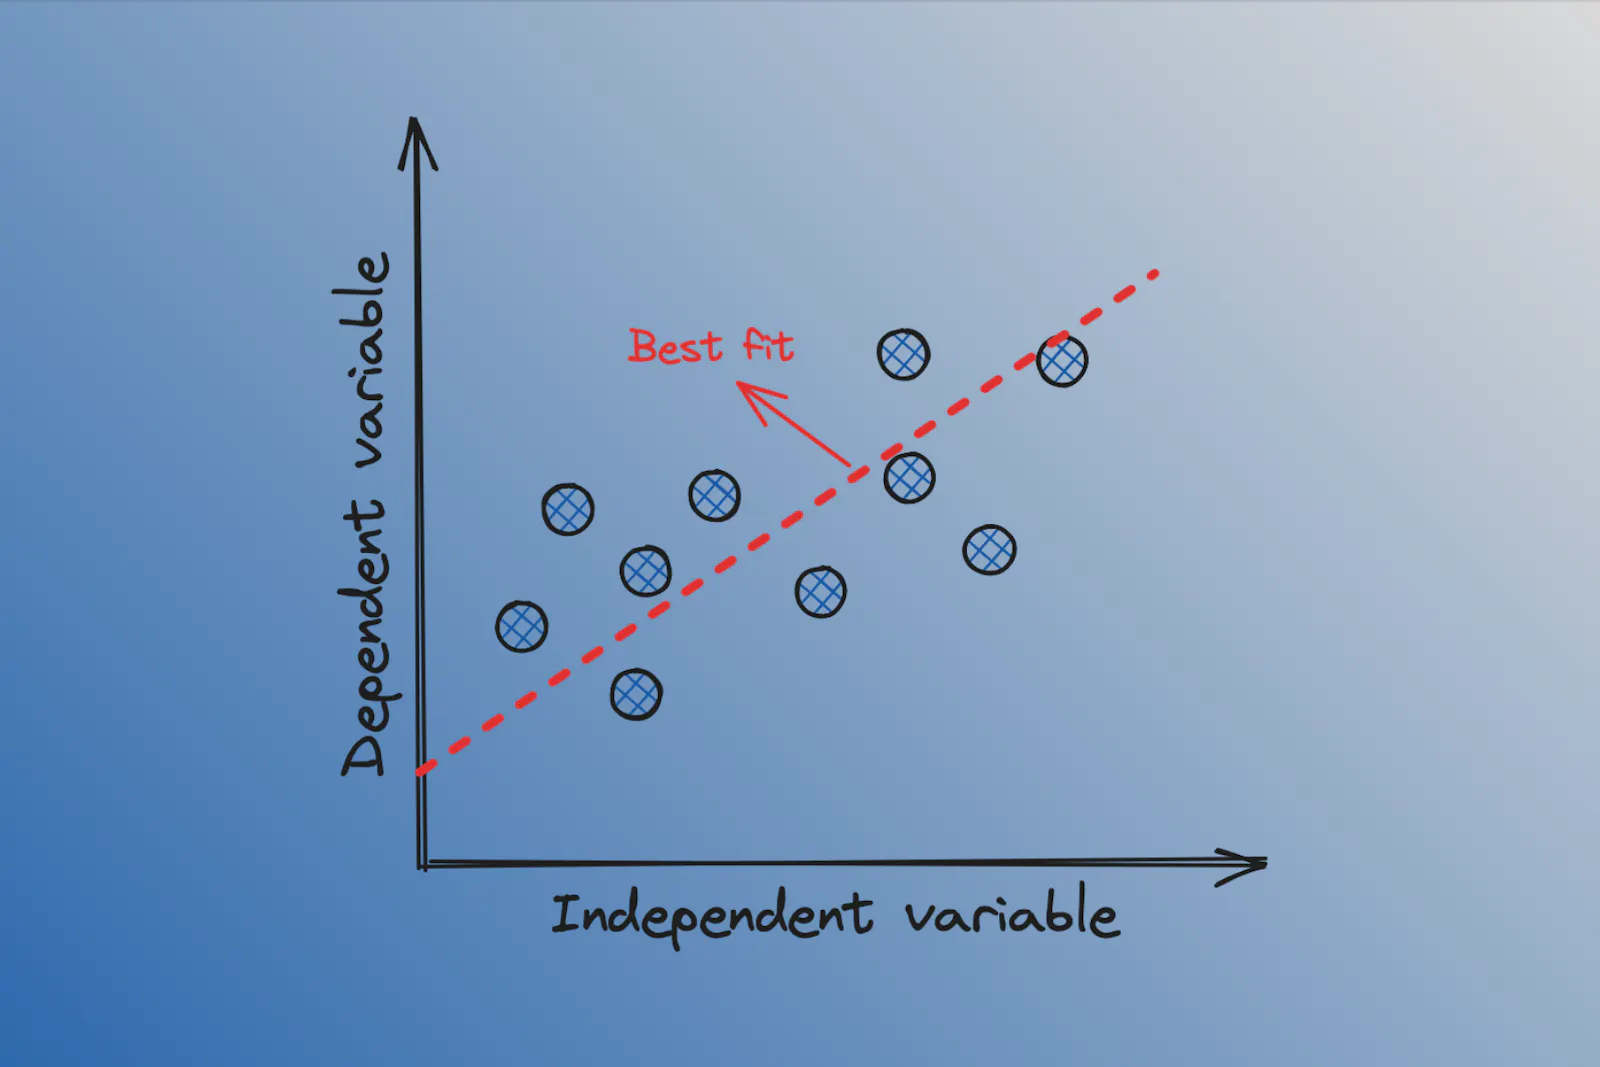
This form of linear regression is known as simple linear regression or univariate linear regression. In simple linear regression, we use one independent variable to predict a dependent variable.
The goal is to find the best-fit line that represents the trend in the data. For example, you can recognize trends in stocks or house prices.
In addition, you can use linear regression to understand the relationship between the two variables. It examines how the change in an independent variable influences the change in a dependent variable.
In the following, you can see the intuition of a simple linear regression:

To read this post you'll need to become a member. Members help us fund our work to ensure we can stick around long-term.
See our plans (Opens in a new window)
Already a member? Log in (Opens in a new window)