In-Depth-Analysis of Procter & Gamble: New All-Time Highs are impressive!
Procter & Gamble's (Opens in a new window) equity story is rooted in its legacy of innovation, brand strength, and consistent financial performance. Founded in 1837, P&G has evolved into a global leader in consumer goods, with a portfolio of iconic brands like Tide, Pampers, Gillette, and Olay. The company's strategy revolves around deep consumer insights, significant investments in research and development, and a commitment to sustainability.
P&G's operational efficiency and global scale enable it to achieve cost advantages and market penetration, ensuring steady revenue growth and robust cash flow. This financial stability underpins P&G's shareholder-friendly policies, including a long history of dividend payments and stock buybacks, highlighting its dedication to returning value to investors.
P&G's ability to adapt to industry trends, such as the rise of e-commerce and increasing consumer demand for sustainable products, further strengthens its market position. The company’s focus on digital transformation and innovative product development ensures it remains at the forefront of the consumer goods sector.
In essence, P&G’s equity story is one of resilient growth, strategic innovation, and reliable returns, making it a compelling investment for those seeking stability and long-term value in the consumer goods market.
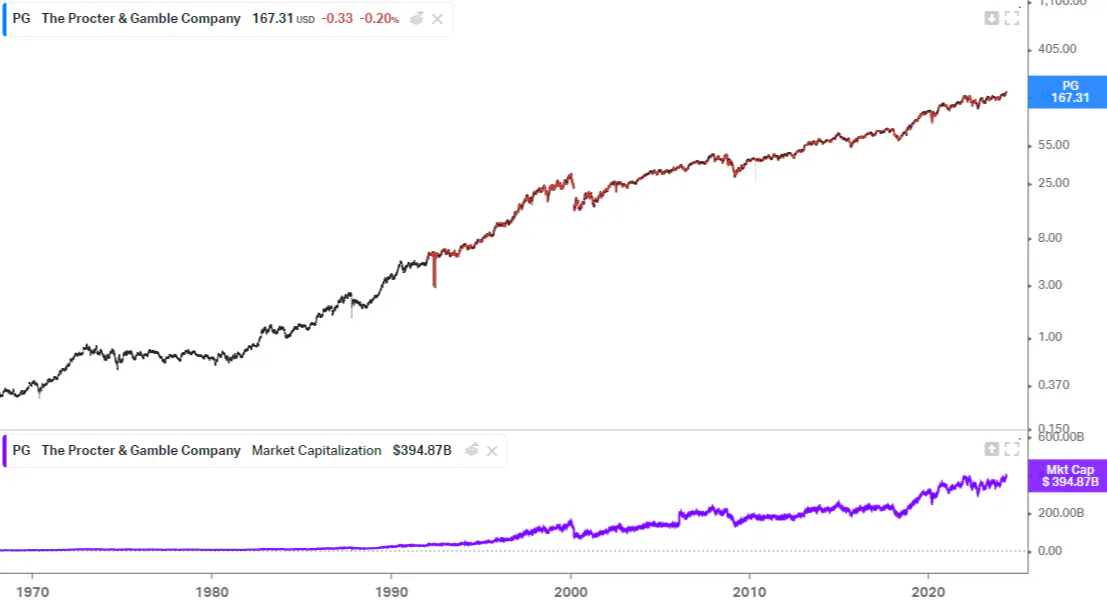
Table of contents
1. History
2. Management and shareholder structure
3. Business model
3.1. Basics of the business model
3.2. Business model
4. Industry
4.1. Industry overview
4.2. Industry trends
4.3. Competitive comparison
5. Key figures
5.1. Sales development
5.2. EBIT and free cash flow
5.3. Distributions (Dividends)
5.4. Outstanding shares
5.5. Balance sheet analysis
5.5.1. Long-Term Debt
5.5.2. Debt-to-Equity Ratio
5.5.3. Return on Equity
5.5.4. Return on Assets
5.5.5. Operating Margin
6. Opportunities and risks
6.1. Strengthen
6.2. Weaknesses
6.3. Opportunities
6.4. Risks
7. Assessment
7.1. Historical multiple rating P/E Ratio
7.2. Price-to-Free Cashflow Ratio
8. Conclusion
To read this post you'll need to become a member. Members help us fund our work to ensure we can stick around long-term.
See our plans (Opens in a new window)
Already a member? Log in (Opens in a new window)